We know how much politics has divided our country over the past few years, but did you know that conservative, liberal and independent voters even tend to travel and vacation differently?
MRI-Simmons is the leading provider of insights on the American consumer. Previously two separate research companies (GfK MRI and Simmons Research), they joined forces in early 2019. As per LinkedIn, “With thousands of attitudinal and behavioral data points, gathered through ongoing surveys and passive measurement, MRI-Simmons empowers advertisers, agencies and media companies with deeper insights into the ‘why’ behind consumer behavior.”
It’s already been determined that people who lean red or blue have different preferences when it comes to television shows, grocery stores, restaurants, hotels, craft beer, and the list goes on and on. So is it any surprise that their vacations tend to be different, as well?

The MRI-Simmons snapshot
According to an NBC News report of MRI-Simmons’ survey, here are some of the key differences between the two groups:
- 57% of liberals had a passport, compared with only 48% of conservatives. This fits in with liberals being more likely to visit a foreign country on their vacation. It may also suggest that blue-leaning people might be more willing to fly to their destination than red-leaning people.
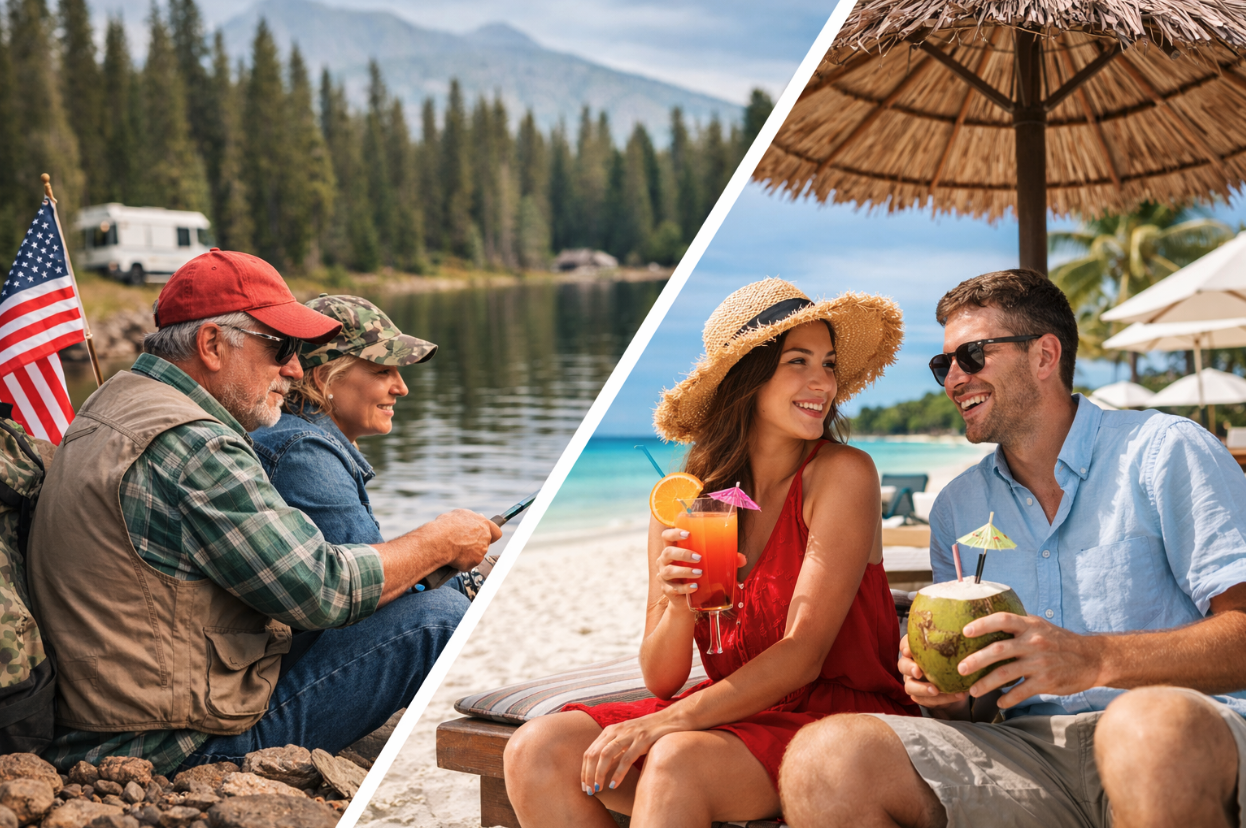
- When wanting to relax, conservatives prefer fishing and golf, whereas liberals prefer going to a beach or experiencing fine dining. It’s thought that liberals tend to be younger and are slightly more likely to have incomes over $100,000, which could tie in with their preferred ways to relax. A 2018 Travel Weekly article also noted that liberals were more likely than conservatives to gravitate toward exploration, experiencing different cultures, experiencing new cuisines, self-discovery, and meeting new people.
Where they vacation: Branson vs. Yellowstone
NBC News showed how different destinations tend to have more left or right-leaning visitors. They used two popular tourist destinations: Branson, Missouri and Park County, Wyoming (the ski area on the eastern edge of Yellowstone National Park). Here are the cities where the most tourists were from for each of the destinations:
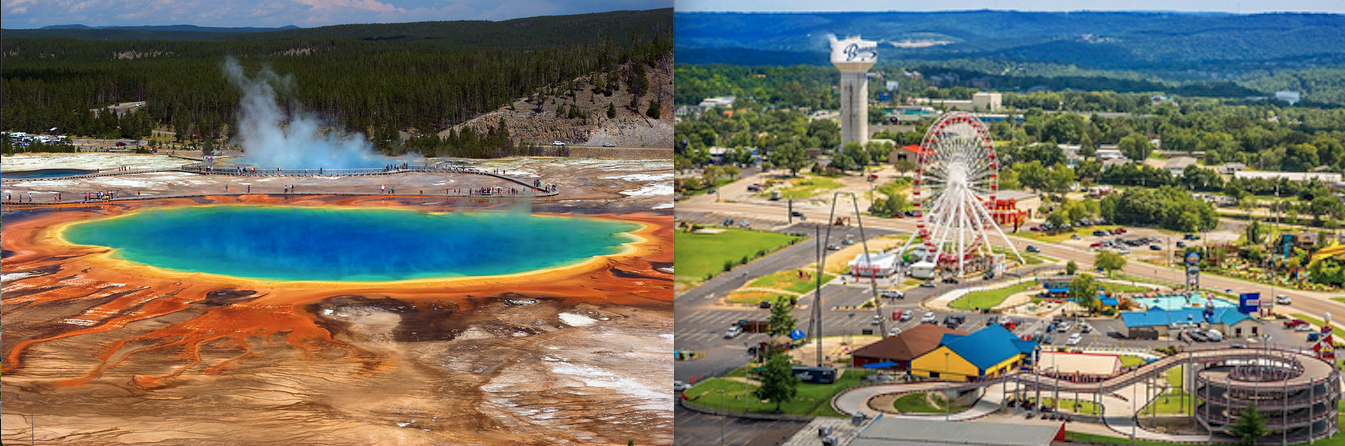
| YELLOWSTONE | BRANSON |
| Denver | Springfield, MO |
| New York | Kansas City |
| Minneapolis | St. Louis |
| Salt Lake City | Little Rock |
| Seattle | Oklahoma City |
Parks like Yellowstone tend to get more visitors from big cities – which means more chance of flying there. But besides that, big cities tend to be politically Democratic. Branson’s visitors tend to be from smaller communities that are closer to their destination – so they drive – and many of them tend to vote Republican.
Have things changed since 2019?
Good point. So, besides looking at that 2019 study, I looked at a few things that were less than 5 years old. I found a couple of interesting things:
- YouGov.com reported in 2021 that the percentage of Democrats vs Republicans vs. Independents (who weren’t even MENTIONED in 2019 reports) who reported having a passport was much closer than NBC News’ report: 41% of Democrats, 38% of Republicans and 37% of Independents reported having a current, valid passport.
- The Washington Post reported in 2023 about the political leanings of people who go on cruises. They discovered that 62% of Republicans would be “very” or “somewhat” comfortable going on a cruise, as opposed to 46% of Independents and 45% of Democrats.
Older surveys (and some quirky findings)
As much as I searched, save for an opinion piece in The Hill, I admittedly couldn’t find a whole lot of modern-day studies that delved into travel and vacation and political leanings. But if you’re willing to go further back in time, there were a few more things I found:
MMGY Global is a travel & tourism marketing agency. They did what they called a “Portrait of the American Traveler 2018-2019,” and they discovered through their surveys that:
- Liberal travelers, at the time, were likely to have spent more on travel in the previous 12 months ($4,859 versus conservatives’ $4,188), and plan to spend more in the next 12 months ($4,790 versus $4,165).
- Liberal travelers were also likely to take more vacations; in the previous twelve months they had taken an average of 3.1 compared to conservatives’ 2.7, and in the next 12 months planned to take 2.9 compared to conservatives’ 2.5.
- Conservative travelers, meanwhile, were more motivated to relax on vacation (94%) than liberal travelers (90%).
- Conservative travelers appeared to be more independent in their travel plans and relied less on OTAs than their liberal counterparts.
- Liberals on vacation reported eating more, drinking more alcohol and having more sex than their conservative peers.
Skift reported on a 2017 Hitwise study of travelers from traditional Democratic and Republican states and discovered:
- Residents of traditionally Republican states in the Deep South and swing states in the Rust Belt were overwhelmingly planning short-haul domestic trips. Meanwhile, residents of traditionally Democratic states in the Northeast and on the West Coast were less likely to plan domestic trips, with data suggesting they leaned toward long-haul, international trips.
- “The Hitwise report found that short-haul travelers spend an average of $1,105 per trip, and 21 percent spend less than $300 per trip. Long-haul travelers spend an average of $3,253 per trip, with 19 percent spending more than $3,000. More than half of short-haul trips involve a car and more than 25 percent involve domestic flights. While nearly 40 percent of long-haul travelers will fly, 21 percent will use a car followed by ships (12 percent), buses (10 percent), and rail (5.7 percent).”
Hipmunk (may they RIP) surveyed travelers in 2015 and discovered:
- When they pack, 46% of Republicans fold their clothes, as opposed to 39% of Democrats. More Democrats (49%) roll their clothes in comparison to Republicans (41%).
- 36% of Republicans preferred beach destinations, as opposed to 22 percent of Democrats.
- 21% of Democrats preferred urban retreats, while only 9% of Republicans said the same.
- Walking tours? 35% of Democrats liked them. Only 25% of Republicans said the same.
- Relaxing by the pool? Fave activity of 40% of Republicans, but only 19% of Democrats
- Even the way people get to the airport varies. 69% of Republicans drive to the airport, 8% take public transportation, 9% use a ride share and 14% use some other mode of transportation. For Democrats, 50% drive to the airport, 17% take public transportation, 15% use a ride share and 18% use some other mode of transportation.
- 30% of Republicans have paid to sit in first class versus only 22% of Democrats.
- 19% of Republicans exceed carry-on baggage limits, as opposed to 27% of Democrats.
- 39% of Democrats avoid airplane bathrooms, as opposed to 48% of Republicans.
- Accommodations? 30% of Republicans prefer boutique hotels; 28% opt for luxury; 24% prefer resorts and 18% like other accommodations. For Democrats, 50% prefer boutique hotels; 16% prefer luxury properties; 16% prefer resorts and 18% go for other accommodations.
- Republicans are more loyal to hotel brands, 29% of Republicans versus 21% of Democrats.
- The Republicans’ favorite hotel perk is free breakfast, named by 46% of Republicans versus 36% of Democrats.
- The Democrats’ favorite hotel perk is free, fast Wi-Fi (37%) versus 30% of Republicans (remember, this was 2015. I’m sure this has changed considerably LOL).
- 18% percent of Republicans choose hotels based on the offerings and amenities versus 9% of Democrats.
- 49% of Democrats choose their hotels based on positive reviews and reputation versus 42% of Republicans.
- Democrats are more likely to travel solo (16%) than Republicans (9%).
- Republicans are more likely to travel with family; 32% of Republicans versus 23% of Democrats.
Final Thought
Of utmost importance: Independents need to be included in more studies in the future!
Of course, all of this doesn’t hold 100% true – case in point, I am decidedly left-leaning, and I like to go fishing. Also, if given a choice, I would prefer a tourist trap place like Branson over the nature of Yellowstone. Meanwhile, I’m sure plenty of right-leaning people love the beach, a good meal, and going skiing.
But I bet there’s one thing we can all agree on, regardless of which side of the political fence we lean on: going on vacation is awesome.
Want to comment on this post? Great! Read this first to help ensure it gets approved.
Want to sponsor a post, write something for Your Mileage May Vary, or put ads on our site? Click here for more info.
Like this post? Please share it! We have plenty more just like it and would love it if you decided to hang around and sign up to get emailed notifications of when we post.
Whether you’ve read our articles before or this is the first time you’re stopping by, we’re really glad you’re here and hope you come back to visit again!
This post first appeared on Your Mileage May Vary

1 comment
I was a math double major and my concentration statistics. This study has so many biases it is basically useless. For example the percentage of people that have a passport is impacted by where they live as much, if not more so, than party affiliation. People in large coastal cities (which tend to vote Democratic) are more likely than a rural area in the middle of the country (more likely Republican). This, again, is more a function of their location than their politics-it just coincides with greater voting preferences. You have to be careful in studies to eliminate variables that could impact the outcome. There are several other obvious impacts outside politics with other info you listed but one good example is enough.