In 2007, London took a bold step: it added a bunch of underused suburban rail lines to its iconic Tube map. These weren’t new lines. In fact, most Londoners barely noticed them before. But with a new name—the London Overground—an orange paint job, and a shiny spot on the same map as the Underground, ridership exploded.
Let’s be clear: this wasn’t just a branding update. It was a complete reframe of how people viewed the city’s rail options. The Overground, previously the domain of rail geeks and the truly local, was now suddenly legible to everyone. It looked like the Tube, acted like the Tube, and crucially, appeared on the same map as the Tube. It worked. Weekly ridership tripled. Entire neighborhoods got back on the map—literally and figuratively.
Enter the Elizabeth Line: Big, Purple, and Popular
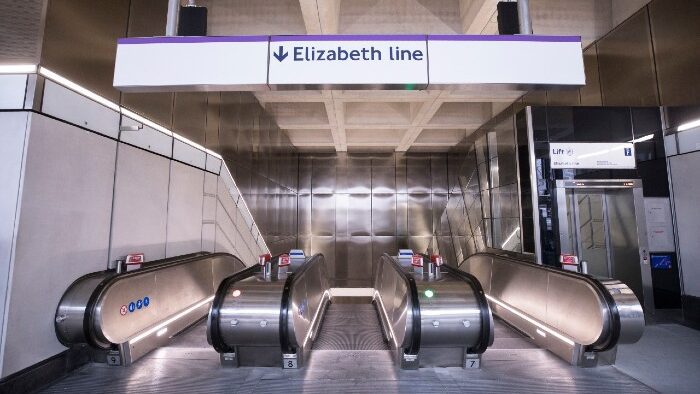
Fast forward a few years, and London did it again. The Elizabeth line, a new high-capacity rail line that runs through the city like a gleaming purple arrow, was given a place of pride on the Tube map. Yes, it technically runs on train tracks and stretches to far-off suburbs like Reading and Heathrow. But the public didn’t care. It was on the map. It had a roundel. It took contactless cards. It felt like part of the system. Result? Half a billion rides in under three years.
The design strategy was deliberate. Stations used the same iconography and signage style as the rest of the Underground. Trains were modern and frequent. And the fare system was fully integrated with London’s existing contactless payment setup. To the average rider, it didn’t matter that this was technically a different mode. It worked like the Tube. It felt like the Tube. So they rode it like the Tube.
The U.S. Transit Fragmentation Problem
So what does this have to do with us, you ask? A lot, actually.
American metro areas—New York, Chicago, D.C., the Bay Area, and beyond—are home to a weird split between subway systems and commuter rail. Subway maps show the city. Commuter rail shows the suburbs. And rarely do the two meet, visually or otherwise. That leaves millions of potential trips stranded in the no-man ‘s-land between systems.
Take New York: the MTA map gives you the subways, but if you want to figure out how to take Metro-North, the LIRR, or even PATH, you’re in for a cartographic scavenger hunt. In D.C., MARC and VRE trains are practically ghost services to the uninitiated. And in the Bay Area, Caltrain and BART coexist like neighboring planets with barely a visual handshake.
A Map Is More Than Just a Map
London’s experiment shows us that the map is the network. If it’s not on the map, people won’t use it. And when you put it on the map—in a clear, branded, easy-to-understand way—they do.
It’s not just about wayfinding. It’s about psychological access. By treating Overground and Elizabeth line trains like everyday transit options, London made more of its rail system usable, visible, and inviting. And riders responded in droves.
This wasn’t a fluke. The Overground grew from roughly 30 million rides a year to nearly 200 million in less than a decade. The Elizabeth line pulled in over 500 million trips in under three years. And both achieved this not just by adding service, but by becoming part of a unified, intuitive, legible map.
Lessons for U.S. Cities
Maybe it’s time U.S. cities started drawing bigger, bolder, more inclusive transit maps. Not just for tourists or trainspotters, but for everyone trying to get across town without checking five apps or needing a decoder ring.
Imagine if Metro-North, LIRR, and PATH were folded into the NYC subway map in a real, consistent way. What if WMATA and MARC were shown on a single diagram? What if BART, Caltrain, and Muni appeared together with shared branding cues?
You don’t need to build new lines overnight. Sometimes the upgrade is simply putting it on the map.
Visibility Breeds Usability
If the Tube map taught us anything, it’s this: visibility breeds usability. Make it legible. Make it integrated. Make it feel like part of the same system.
Transit systems across the U.S. already have the infrastructure in place. What they need now is coherence. A map is not just a diagram—it’s an invitation. And if we want more people to say yes to that invitation, we should make sure they can actually see it.
Want to comment on this post? Great! Read this first to help ensure it gets approved.
Want to sponsor a post, write something for Your Mileage May Vary, or put ads on our site? Click here for more info.
Like this post? Please share it! We have plenty more just like it and would love it if you decided to hang around and sign up to get emailed notifications of when we post.
Whether you’ve read our articles before or this is the first time you’re stopping by, we’re really glad you’re here and hope you come back to visit again!
This post first appeared on Your Mileage May Vary

1 comment
It’s all very true. TFL have successfully harmonized their various operations into one larger system. But here in the US, it’s a mess. Probably the most orderly system is Boston’s MBTA and even that is split between the urban T and Commuter Rail; Philly’s SEPTA is similar, but then NJT across the river is rarely thought of either
. In addition to New York (as you mentioned), there’s Chicago, where the CTA and Metra don’t seem to be on speaking terms. As for the Bay Area, it’s even worse than you wrote: yes, there’s BART, and there’s Caltrain, but there’s also the SF MUNI system which isn’t even recognized on BART system maps. Not to mention that San Jose has a light rail system which could theoretically connect with BART but it’s as if neither system exists either. We could learn a lot from a relatively inexpensive solution like this.