If you’ve flown more than a few times, chances are you’ve experienced turbulence. But some routes are consistently bumpier than others — and now we know which ones top the list.
When you’re going to experience turbulence, the pilot will typically come on the PA system and announce that you’re about to experience some “rough air” (or “air pockets,” “choppy conditions” or a “bumpy ride,” among others). This will be followed by being told not to leave your seats (yeah, don’t be like this guy), the seatbelt sign going on, and possibly the flight attendants being told to go to their seats, as well. And then you start feeling varying degrees of turbulence in the form of shaking, rocking, occasionally a very brief “freefall” feeling, etc.
Understanding Levels of Turbulence
There are all different levels of turbulence and, not surprisingly, each level has a name. Different locations in the atmosphere have different amounts of turbulence at different times, although some places are well known for their high levels of turbulence. In fact, there are some places planes won’t fly over, and one of the reasons is because there’s so much turbulence.
Fortunately, there aren’t such places in the U.S. Which isn’t to say we don’t have turbulence up there over our country; we do. And there’s a website that has even figured out which airline routes are the most turbulent.
Turbli describes itself as a turbulence forecast tool. Introduced in 2020, they collect and analyze data, obtained by NOAA/NWS and the Met Office (the latter is the UK’s national weather service), on worldwide turbulence, which they make available to travelers and pilots alike.
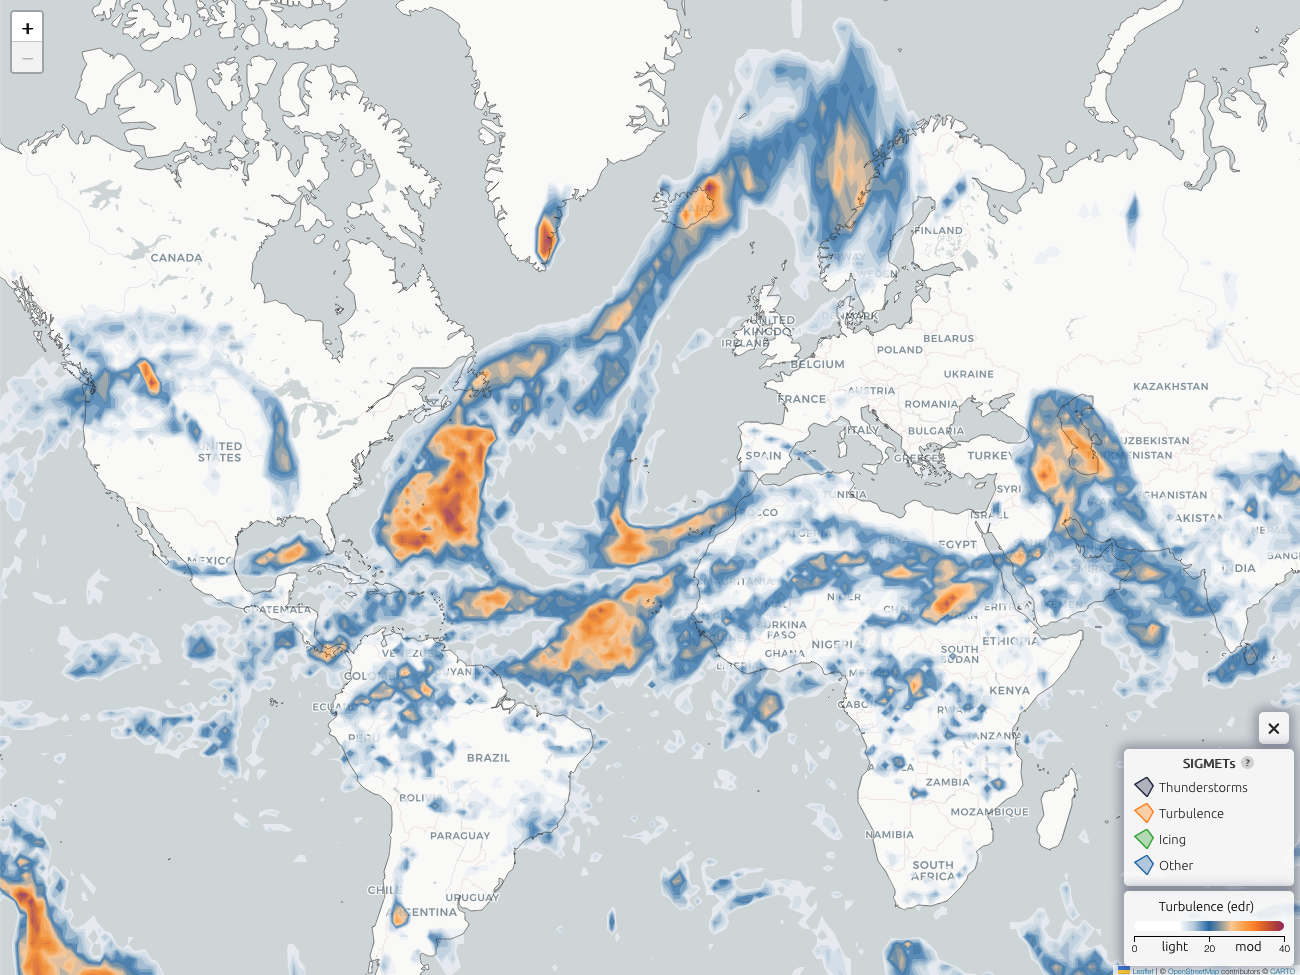
For regular flyers like us, Turbli has an interactive turbulence map, where you can get a current picture of the world’s turbulence at altitudes from about 14,000 feet to about 37,000 feet (you have to toggle between meters and feet). The map is updated every 6 hours and can show forecasts for 3, 6, 9 and 12 hours into the future.
Anyway, Turbli takes an annual look at the data from about 10,000 routes that planes take, worldwide – ones that connect about 500 airports – and ranks them based on their level of turbulence.
To give you an idea of what that “average turbulence” is, figure:
- 0–20 is light
- 20–40 is moderate
- 40–60 is strong
- 60–80 is severe
- Anything above 80 is extreme
Here’s what each of those measurements mean.
The Most Turbulent Routes in the U.S. in 2025
Here are the 10 most turbulent routes in the United States in 2025:
| # | Route | Distance (km) | Avg. turbulence (edr) |
|---|---|---|---|
|
1
|
Denver (DEN) – Jackson (JAC) | 653 | 18.18 |
| 2 | Albuquerque (ABQ) – Denver (DEN) | 561 | 18.18 |
| 3 | Jackson (JAC) – Salt Lake City (SLC) | 329 | 17.676 |
| 4 | Denver (DEN) – Salt Lake City (SLC) | 629 | 17.538 |
| 5 | Bozeman (BZN) – Denver (DEN) | 843 | 17.221 |
| 6 | Boise (BOI) – Bozeman (BZN) | 471 | 16.519 |
| 7 | Bozeman (BZN) – Salt Lake City (SLC) | 558 | 16.486 |
| 8 | Albuquerque (ABQ) – Salt Lake City (SLC) | 793 | 16.17 |
| 9 | Denver (DEN) – Las Vegas (LAS) | 1010 | 16.128 |
| 10 | Las Vegas (LAS) – Salt Lake City (SLC) | 591 | 16.109 |
Global Turbulence Rankings in 2025
And these were the most turbulent routes in the world in 2025:
| # | Route | Distance (km) | Avg. turbulence (edr) |
|---|---|---|---|
|
1
|
Mendoza (MDZ) – Santiago (SCL) | 196 | 22.983 |
| 2 | Xining (XNN) – Yinchuan (INC) | 433 | 18.935 |
| 3 | Chengdu (TFU) – Xining (XNN) | 724 | 18.758 |
| 4 | Cordoba (COR) – Santiago (SCL) | 660 | 18.643 |
| 5 | Santa Cruz (VVI) – Santiago (SCL) | 1905 | 18.33 |
| 6 | Chengdu (TFU) – Lanzhou (LHW) | 692 | 18.322 |
| 7 | Mendoza (MDZ) – Salta (SLA) | 940 | 18.307 |
| 8 | Chengdu (CTU) – Yinchuan (INC) | 890 | 18.282 |
| 9 | Xining (XNN) – Lhasa (LXA) | 1312 | 18.181 |
| 10 | Denver (DEN) – Jackson (JAC) | 653 | 18.18 |
Look at our very own DEN making the top ten! 😉
Other turbulent routes in 2025
Turbli broke down several other routes, including:
- Routes by continents (North America [as seen above], South America, Europe, Asia, Oceania, Africa)
- Routes by distance (short- medium- and long-range routes)
You can see all of their data on this page of Turbli’s website.
So while turbulence is usually harmless, knowing which routes tend to be bumpier can at least help you know what to expect before you board.
Want to comment on this post? Great! Read this first to help ensure it gets approved.
Want to sponsor a post, write something for Your Mileage May Vary, or put ads on our site? Click here for more info.
Like this post? Please share it! We have plenty more just like it and would love it if you decided to hang around and sign up to get emailed notifications of when we post.
Whether you’ve read our articles before or this is the first time you’re stopping by, we’re really glad you’re here and hope you come back to visit again!
This post first appeared on Your Mileage May Vary
